Script:
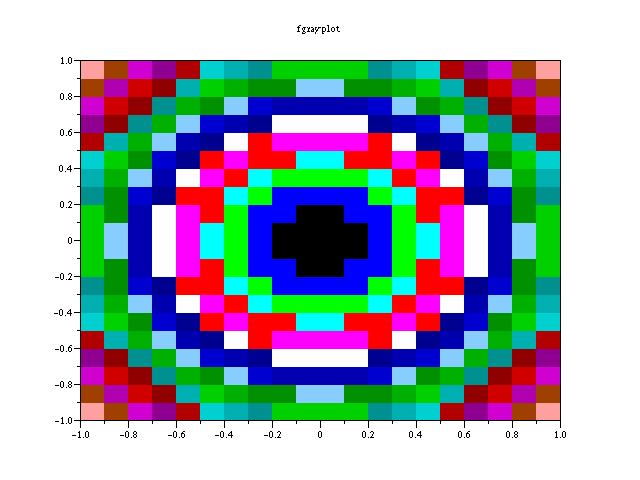
deff('[z]=surf(x,y)','z=x**2+y**2');
fgrayplot(-1:0.1:1,-1:0.1:1,surf);
xtitle('fgrayplot ',' ',' ');
This demo draw the grayplot of a surface defined
by a function
1.Send the script to the Server and receive the picture.
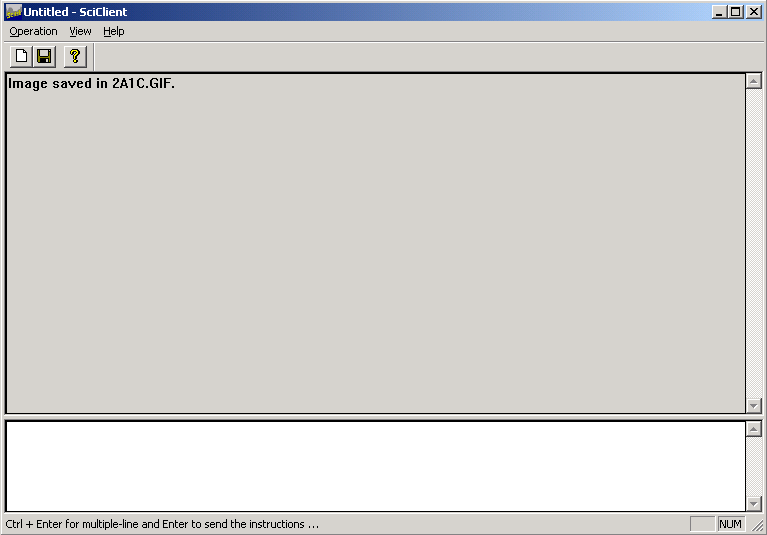
the window shows a piece of message.

the picture of the function

<<Previous Next>>
|