Script:
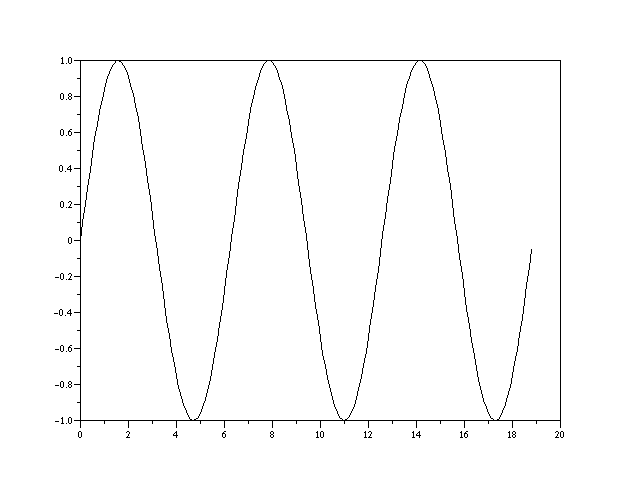
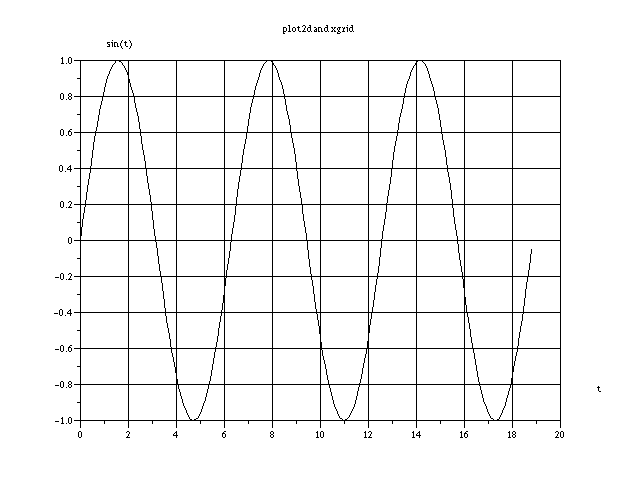
t=(0:0.1:6*%pi);
plot2d(t',sin(t)');
xtitle('plot2d and xgrid ','t','sin(t)');
xgrid();
1. If you send the scripts to the Server step by
step ,you will see the screen changes like the picture
below.
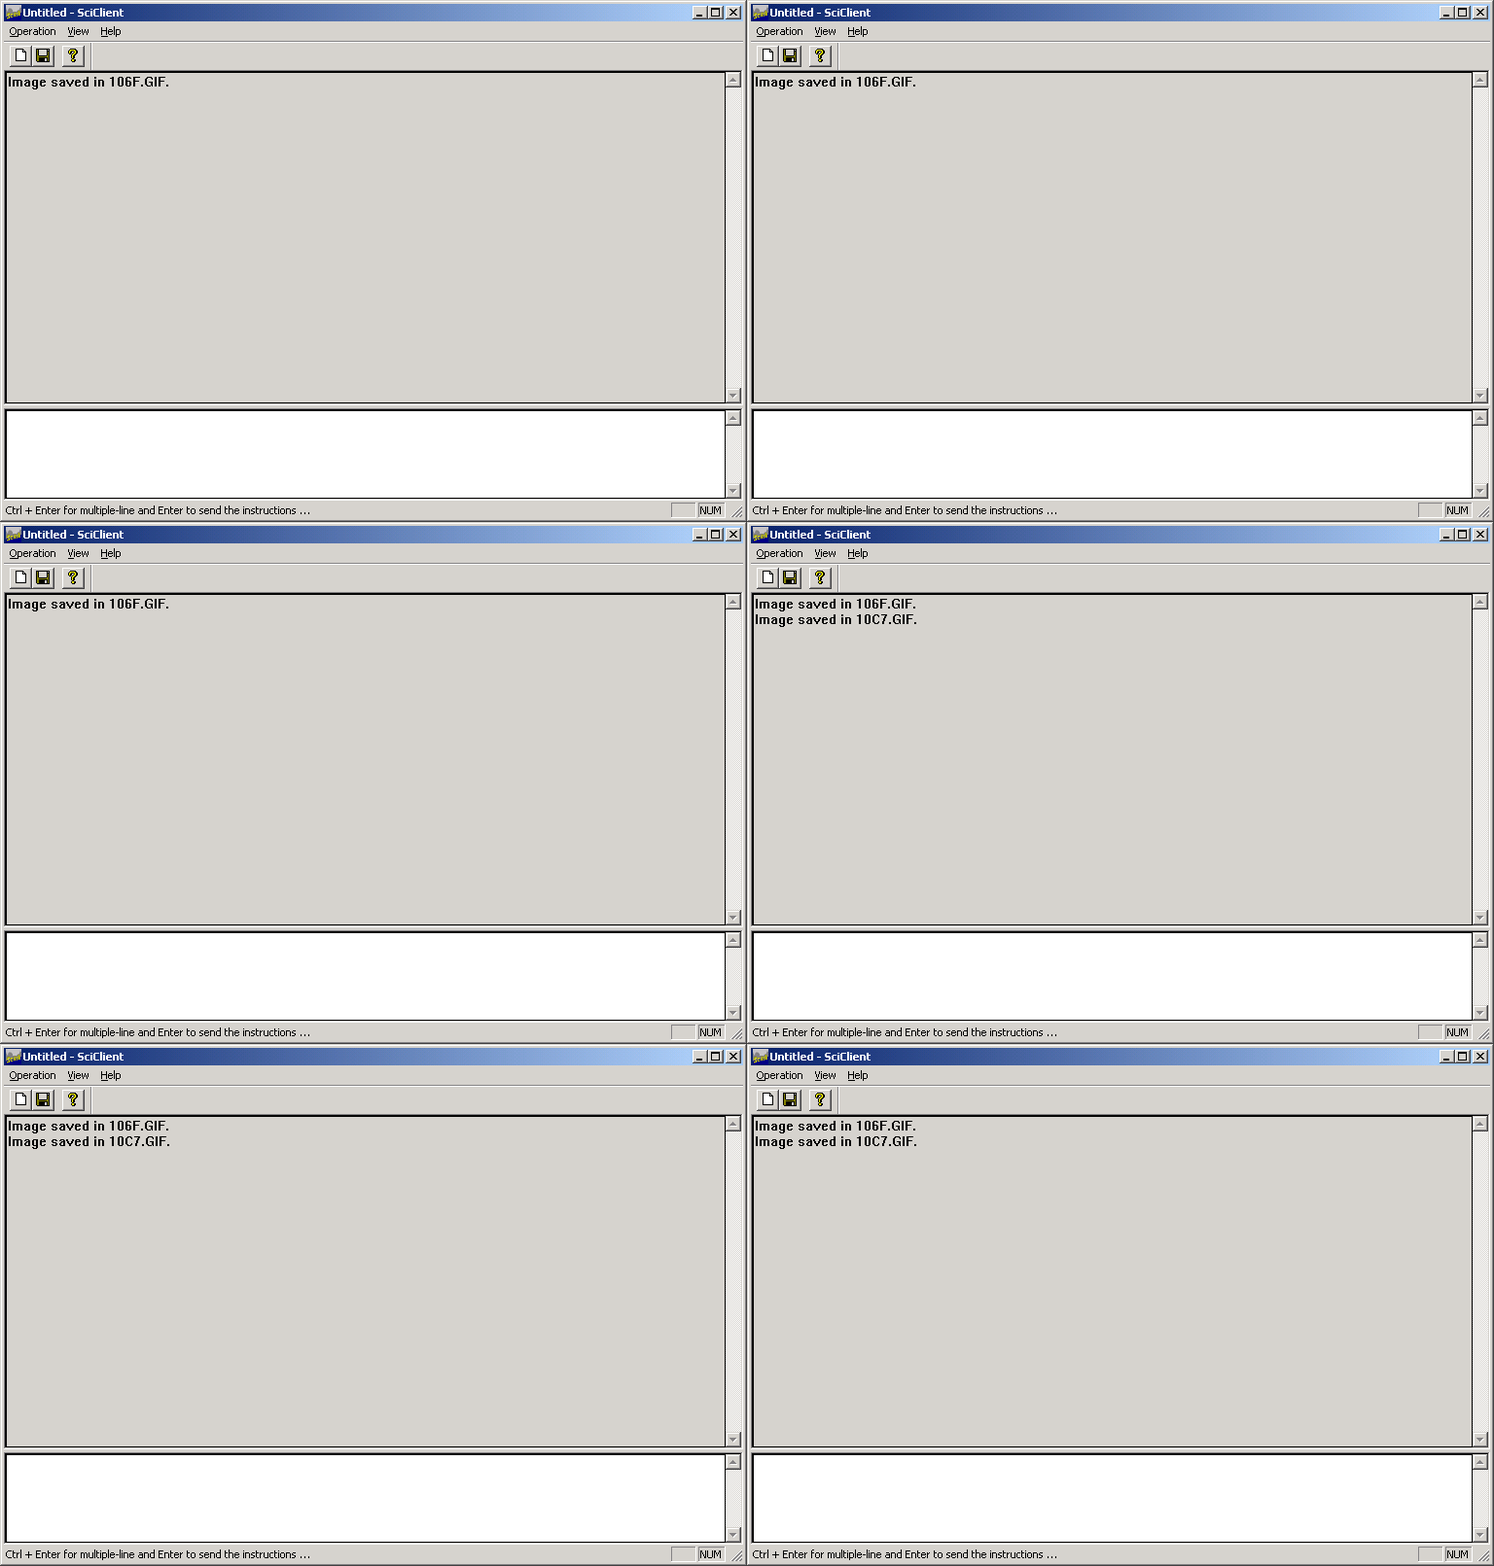
and you will receive three pictures in your machine.


2.If you send the scripts together,the picture received
from the Server is as below:
<<Previous Next>>
|