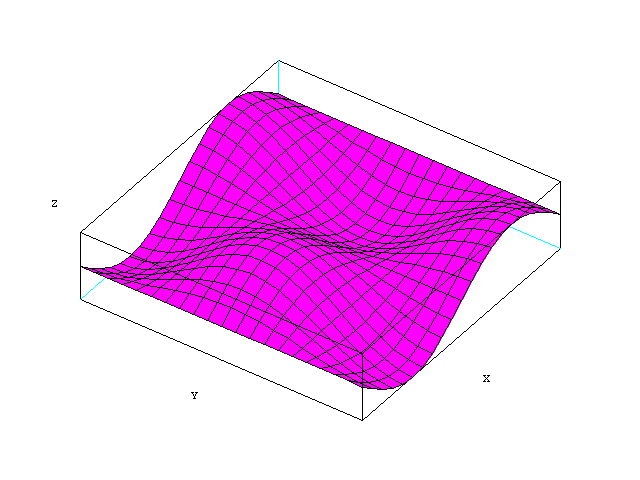
Script: 
                           
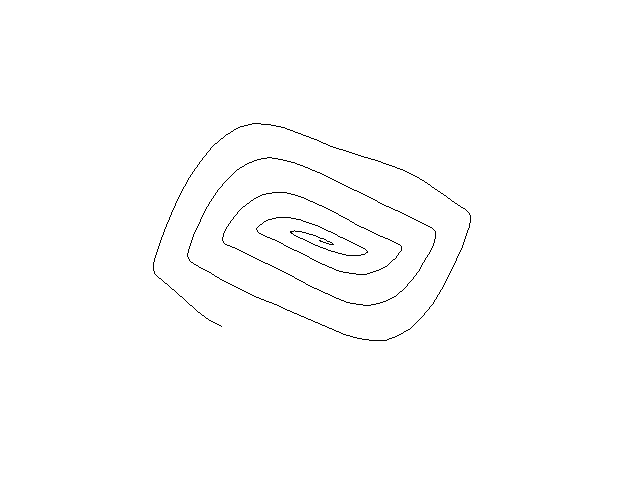
                          r=(%pi):-0.01:0;x=r.*cos(10*r);y=r.*sin(10*r); 
                          deff('[z]=surf(x,y)','z=sin(x)*cos(y)'); 
                          t=%pi*(-10:10)/10; 
                          fplot3d(t,t,surf,35,45,'X@Y@Z',[6,2,3]); 
                          z=sin(x).*cos(y); 
                          write(%io(2),"Adding 2d graphics on 3d graphic'); 
                          z=sin(x).*cos(y); 
                          [x1,y1]=geom3d(x,y,z); 
                          xpoly(x1,y1,'lines');  
                           1. If you send the scripts to the Server step by 
                            step ,you will see the screen changes like the picture 
                            below. 


                            and you will receive three pictures in your machine. 


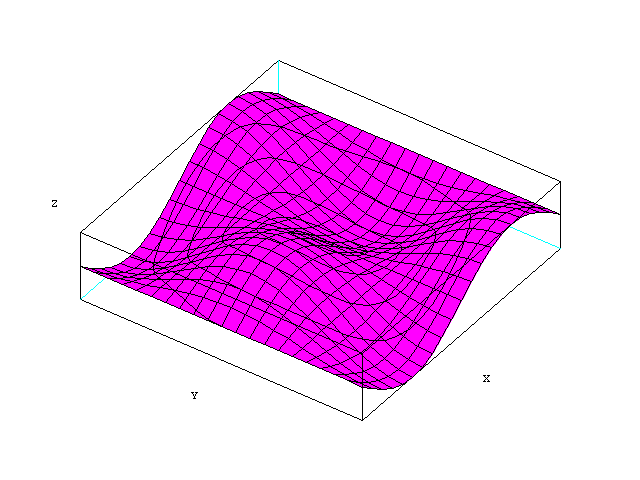
                            2.If you send the scripts together,the picture received 
                            from the Server is as below: 


                          <<Previous     Next>> 
                           |